In March of 2015, I took the time to program a Google spreadsheet to display my income and deductions based on certain categories for tax year 2014. Yesterday, I started tax prep for this year and I remembered that work I had done in Google Sheets. I am writing about it here because maybe someone else would find the information useful. But really, don’t want to forget how it works, so this will be my online record.
Because what is more fun than doing taxes? Writing a blog post about how you do your taxes.
I can tell you that in 2015 I was mostly an actor. I have the data to back it up… my income from 2015. Of course after reading this, you might realize I also spend a good part of the year as a programmer.
Background
You probably don’t care about this part, but hey.
I use a program called YNAB, short for You Need A Budget, to track all my spending. Actually, I use it to set a budget and then track my money within the budget, but you get the idea. It has every financial transaction I have made for the last few years. I use colored flags (YNAB allows 6 different ones) to keep track of tax-related income and spending. I export the data for a year to a CSV and import it into a Google Sheets file. After I do this, I add a little more data to all of my spending and income.
I have non-trivial income from 4 areas:
- My W-2 and Schedule C income as an actor/entertainer
- My Schedule C income as a Yoli Member
- My W-2 and Schedule C income as an independent designer/developer/technical consultant
- My W-2 wages from anything that doesn’t fit in the above1
Once I have all my transactions imported into a Google spreadsheet, I go about marking all the income as either W-2 or Schedule C. Then I mark all of the deductible expenses according to the categories that the government accepts based on each area of income (type of business). Learning these categories has taken years. Finally, I copy the data over to a new sheet and delete all the transactions that the IRS doesn’t care about. Mostly they don’t care what I buy, but they are really interested in what I earn. Go figure.
The Good Stuff
When everything is all done I have this data structure:
---------- Columns from YNAB ----------
   Column A: Account (checking, etc.)
 * Column B: Flag (one of six color names or nothing)
   Column C: Date
 * Column D: Payee
   Column E: Category Group: Category
   Column F: Category Group
   Column G: Category
   Column H: Memo (taken at time of purchase)
 * Column I: Outflow
 * Column J: Inflow

---------- Columns I added -----------
 * Column K: Tax Category (income type or deduction type)
   Column L: Notes (for use while doing my taxes)
The columns marked with an asterisk are the important ones at tax time for me. The others are important during the year. At this point, I have all of the data I need to do my taxes (including W-2’s and such). But it is in a spreadsheet which is certainly not a database. I have to manually sort and shuffle all the data around to get at what I need. Or do I?
Turns Out™ that Google allows you to query your spreadsheet data just like you’d query database data. What? Yes.
=query(_taxable_,
  "SELECT
    D, sum(J)-sum(I)
  WHERE
    B='Purple' AND I>0
  GROUP BY D
  ORDER BY
    sum(J)-sum(I) ASC"
,0)
In the code above, _taxable_ is a keyword for a named range of rows and columns. In my case, it is all but the first row from the sheet with all my tax-related transactions. Then the bit in quotes is SQL (actually, it’s GVAQL, but whatever). It basically says “Show me payees and the total I paid to each of them if they’ve got a Purple Flag.”
The confusing part might be the sum(J)-sum(I) bit. Why the sum() thing and why subtract outflow from inflow? The sum() function is required since I am saying GROUP BY D. The query needs to know how to take care of smashing all the numbers together. In this case, add them. I am subtracting I from J because that is a simple way to get a negative number for my outflows and a positive number for my inflows without having to change the code as I copy and paste it elsewhere.
The final 0 at the end of the function call is just telling the function there are zero header rows in _taxable_. I already omitted the header by making that named range start at row 2.
The purple flag in my transaction data (literally, a string that says "Purple" after YNAB exports it) stands for charitable giving, and since I don’t mind sharing that with you, here is what happens when you put that code (all in one line) in cell F:2 in my case:
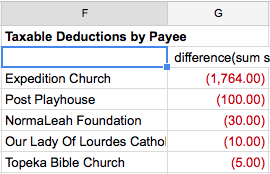
None of those other cells below row 1 had anything in them before I entered the code into F:2. You can see that the return from the query will be plopped down into the spreadsheet, so be sure you have room for the return value you are going to get.
I use this type of query all over my “results” sheets and it saves me tons of time while I am filling out all the fields in Turbo Tax. Just tweaking the query a bit here and there can give you all sorts of great insights into your data. I hope that it proves useful to someone else out there.
If not, how on Earth did you make it to the end of this blog post? You deserve some kind of reward.
-
These days, this income is from Flixpress.com, which even though it may seem to fit into the “designer/developer/tech consultant” category, I do keep it separate from that since it is not independent. Tell me I can save money by not doing that, and I’ll be happy to re-categorize, though. ↩